Spring / Spring Boot
Explain how to find the process uptime using Actuator endpoint in Spring boot.
We may use "metrics" actuator endpoint. Spring Boot provides "metrics" endpoint that can be used diagnostically to examine the metrics collected by an application. The endpoint is not available by default and must be exposed.
management.endpoints.web.exposure.include=info,health,metrics
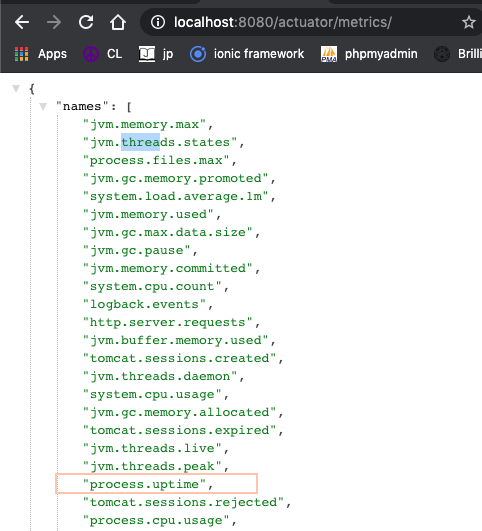
When the application is up, access the metrics endpoint using http://localhost:8080/actuator/metrics/ (default). Navigating to /actuator/metrics displays a list of available meter names. You can drill down to view information about a particular meter by providing its name as a selector, e.g. /actuator/metrics/jvm.memory.max.
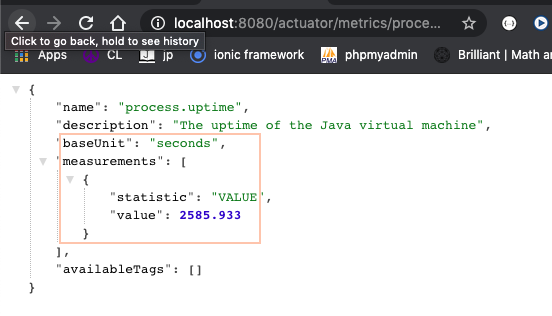
To access the process uptime, we may use the particular meter "process.uptime". Navigate to this particular meter using the URL : http://localhost:8080/actuator/metrics/process.uptime
Invest now in Acorns!!! 🚀
Join Acorns and get your $5 bonus!
Acorns is a micro-investing app that automatically invests your "spare change" from daily purchases into diversified, expert-built portfolios of ETFs. It is designed for beginners, allowing you to start investing with as little as $5. The service automates saving and investing. Disclosure: I may receive a referral bonus.

Invest now!!! Get Free equity stock (US, UK only)!
Use Robinhood app to invest in stocks. It is safe and secure. Use the Referral link to claim your free stock when you sign up!.
The Robinhood app makes it easy to trade stocks, crypto and more.

Webull! Receive free stock by signing up using the link: Webull signup.
More Related questions...